Bootstrapping and bootstrap confidence intervals for linear mixed models
(EDIT: I have also written a more theoretical blog post on the topic.)
During the last couple of days, I have added some parametric bootstrap capabilities to mixed_models. The following demonstrates first how to resample fixed effects coefficient estimates via bootstrapping. Then various types of bootstrap confidence intervals are presented. Examples of computation and a brief comparison of different types of bootstrap confidence intervals are given.
Implementation of bootstrap methods is motivated by the fact that the only alternatives currently available in mixed_models are based on the Wald Z test statistic, which is far from being optimal in many settings, as I have briefly delineated in a previous blog post.
Parametric bootstrap
Parametric bootstrap for linear mixed models is performed via LMM#bootstrap. Behind the scenes, for the model formulation which is summarized in a previous blog post, bootstrap samples of the parameter estimates are obtained by the following procedure (as outlines in this paper).
-
Fit a linear mixed model to obtain the estimated fixed effects \(\hat{\beta}\), the estimated random effects covariance matrix \(\hat{\Sigma}\), and the estimated scaling factor (or residual variance) \(\hat{\sigma}^2\).
-
Generate a bootstrap sample as \(y^{\ast} = X\hat{\beta} + Zb^{\ast} + o + \varepsilon^{\ast}\), where we randomly sample \(b^{\ast} \sim N(0, \hat{\Sigma})\) and \(\varepsilon^{\ast} \sim N(0, \hat{\sigma}^2 W^{-1})\).
-
Re-fit the linear mixed model to the bootstrap data to obtain bootstrap parameter estimates.
-
Repeat steps 2-3
nsimtimes.
This resampling procedure can be performed in parallel using the Ruby gem parallel or single-threaded (more on that below).
By default LMM#bootstrap returns a bootstrap sample of the fixed effects coefficient estimates, but estimates of any other parameter can be returned as a bootstrap sample if an appropriate Proc is passed as argument what_to_collect.
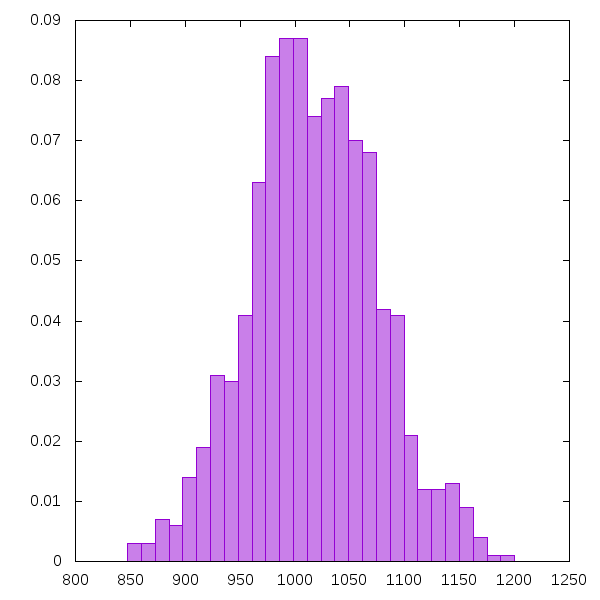
As an example let’s generate a bootstrap sample of the intercept term for the alien species data. The following code does the job:
require 'mixed_models'
df = Daru::DataFrame.from_csv './data/alien_species.csv'
model_fit = LMM.from_formula(formula: "Aggression ~ Age + Species + (Age | Location)", data: df)
result = model_fit.bootstrap(nsim: 1000)
y = nsim.times.map { |i| result[i][:intercept] }
Notice that I didn’t pass the argument what_to_collect to #bootstrap, because the intercept is one of the fixed effects terms which are collected by default.
Using the gem gnuplotrb, I can plot a histogram of the obtained bootstrap sample, in order to see the shape of its distribution. As expected, it looks approximately like a normal density.
The image was produced by the following code.
require 'gnuplotrb'
include GnuplotRB
bin_width = (y.max - y.min)/10.0
bins = (y.min..y.max).step(bin_width).to_a
rel_freq = Array.new(bins.length-1){0.0}
y.each do |r|
  0.upto(bins.length-2) do |i|
    if r >= bins[i] && r < bins[i+1] then
      rel_freq[i] += 1.0/y.length
    end
  end
end
bins_center = bins[0...-1].map { |b| b + bin_width/2.0 }
plot = Plot.new([[bins_center, rel_freq], with: 'boxes', notitle: true],
                style: 'fill solid 0.5')
Bootstrap confidence intervals
Of course, confidence intervals can be constructed based on the bootstrap samples obtained via LMM#bootstrap. This functionality is now included in LMM#fix_ef_conf_int. For example, still using the alien species data, basic bootstrap confidence intervals with confidence level of 95% for the fixed effects coefficient estimates can be computed with:
ci_bootstrap = model_fit.fix_ef_conf_int(method: :bootstrap, boottype: :basic, nsim: 1000)
The result is a Hash of interval bounds for each fixed effects term:
{:intercept=>[901.1323777908297, 1127.8830074251803],
:Age=>[-0.24497613247630068, 0.10778076861255856],
:Species_lvl_Human=>[-500.23358644022164, -499.1708950551018],
:Species_lvl_Ood=>[-900.1587789864999, -899.0059837383694],
:Species_lvl_WeepingAngel=>[-200.1445476541481, -199.0552908625565]}
Bootstrap interval types
There are currently four types of bootstrap confidence intervals implemented: basic, normal, percentile and studentized (default). All methods are taken from Chapter 5 in A. C. Davison and D. V. Hinkley, Bootstrap Methods and their Application (Cambridge Series in Statistical and Probabilistic Mathematics, 1997).
Denote the \(p\) percentile of the bootstrap sample of a parameter \(\theta\) as \(\theta\subscript{p}^{\ast}\). Denote the point estimate of \(\theta\) as \(\hat{\theta}\), and the point estimate of the variance \(v\) of \(\theta\) as \(\hat{v}\).
- Basic bootstrap intervals are computed according to (5.6) in Chapter 5 of Davison & Hinkley as
- Normal bootstrap intervals are based on the normal distribution using resampling estimates \(b\subscript{R}\) and \(v\subscript{R}\) for bias correction and variance estimation, as given in (5.5) in Chapter 5 of Davison & Hinkley. The corresponding formula is
- Percentile bootstrap intervals are computed according to (5.18) in Davison & Hinkley as
- Studentized bootstrap confidence intervals, also known as bootstrap-t, are based on the normal approximation confidence limits but use a bootstrapped version of the \(N(0,1)\) variable \(z\), as given in (5.7) in Chapter 5 of Davison & Hinkley. The studentized interval can be written as
For more detail on the computation of the confidence intervals we refer to Davison & Hinkley and this wikipedia article.
Comparison of confidence interval methods
Which confidence interval method to use is determined by the arguments method (possible are :wald, :bootstrap and :all) and boottype (possible are :basic, :normal, :studentized and :percentile).
The method :all returns a Daru::DataFrame containing the confidence intervals obtained by each of the available methods. The data frame can be printed in form of a nice looking table for inspection. For example for the alien species data we obtain all types of 95% confidence intervals with
ci = model_fit.fix_ef_conf_int(method: :all, nsim: 1000)
and print them to screen as a table with
# round all results to two decimal places
ci.each_vector do |v|
  v.each_index { |i| v[i][0], v[i][1] = v[i][0].round(2), v[i][1].round(2)}
end
puts "Confidence intervals obtained with each of the available methods:"
puts ci.inspect(20)
which yields
Confidence intervals obtained with each of the available methods:

#<Daru::DataFrame:70245799731260 @name = 1a212339-2e38-4c4c-8f08-f2edc3668f30 @size = 5>
                                intercept                  Age    Species_lvl_Human      Species_lvl_Ood Species_lvl_WeepingA
              wald_z     [898.3, 1134.27]        [-0.24, 0.11]   [-500.22, -499.17]   [-900.12, -899.02]   [-200.13, -199.05]
          boot_basic    [902.48, 1136.56]        [-0.24, 0.11]   [-500.22, -499.18]    [-900.1, -899.03]   [-200.13, -199.06]
           boot_norm    [897.88, 1131.31]        [-0.23, 0.11]    [-500.2, -499.16]   [-900.09, -899.01]   [-200.12, -199.05]
              boot_t    [902.48, 1136.56]        [-0.24, 0.11]   [-500.22, -499.18]    [-900.1, -899.03]   [-200.13, -199.06]
           boot_perc     [896.02, 1130.1]         [-0.25, 0.1]   [-500.21, -499.17]   [-900.11, -899.04]   [-200.12, -199.05]
Since here we are dealing with data that was simulated according to the assumptions of the linear mixed model, all parameters end up approximately meeting the normality assumptions, and therefore all confidence interval methods turn out to be pretty much equivalent. Often when analyzing less ideal data, this will not be the case. Then it might be necessary to compare different types of confidence intervals in order to draw the right conclusions.
Theoretical results given in Chapter 5 of A. C. Davison and D. V. Hinkley, Bootstrap Methods and their Application guarantee that for statistics which are approximately normal, the studentized bootstrap confidence intervals are second order accurate, meaning that a confidence interval with confidence level of \((1-\alpha)\cdot 100\) contains the true value with a probability of \((1-\alpha) + \mathcal{O}(n^{-1})\), where \(n\) is the sample size. The basic and percentile bootstrap methods however are only first order accurate, that is, the interval coverage is correct only up to an order of \(n^{-1/2}\). Nevertheless, for equi-tailed confidence intervals (as are all intervals considered above), the basic and percentile methods are second order accurate as well. The normal bootstrap and Wald Z confidence intervals are first order even when they are equi-tailed. Also note that all theoretical results here assume that the bootstrap sample is sufficiently large.
In general, it appears that basic, percentile and studentized intervals are superior in accuracy compared to the normal bootstrap and Wald Z intervals in all circumstances. However, the normal bootstrap interval adjusts for the bias, and only the studentized bootstrap method adjusts for nonconstant variance and skewness as well as bias.
Of course, the Wald Z method has the advantage of being computationally efficient and convenient. All bootstrap intervals are computationally very heavy, especially for big data sets. Thus, it is probably best to use the Wald Z intervals in the data exploration phase, and compare different kinds of bootstrap intervals once it is more clear what to look for.
Parallel execution
Finally I also want to examine the parallel computing capabilities of the bootstrap confidence interval methods a little. The following code benchmarks the computation of studentized bootstrap confidence intervals in parallel and single-threaded.
require 'benchmark'
ci_bootstrap = nil
Benchmark.bm(17) do |bm|
  bm.report('single-threaded') do
    ci_bootstrap = model_fit.fix_ef_conf_int(method: :bootstrap, nsim: nsim, parallel: false)
  end

  bm.report('parallel') do
    ci_bootstrap = model_fit.fix_ef_conf_int(method: :bootstrap, nsim: nsim, parallel: true)
  end
end
The obtained results are given in this table.
                        user     system      total        real
single-threaded   101.540000   0.000000 101.540000 (101.452211)
parallel           16.150000   0.030000 170.980000 ( 55.285422)
The parallel execution does in fact utilize all threads on both cores of my laptop (as I can simply observe by watching htop). As expected, the parallel execution turns out to be about twice as fast as single-threaded.